The Victims of Fatal Traffic Accidents
Visualizing gender and age for fatal traffic accidents in the United States
Welcome 🎉
Welcome to a new day of the DataCanvas Daily newsletter. If you want a new, beautiful, and insightful data visualization daily, look no further!
Let’s have a look at today’s chart.
Daily Chart: The victims of traffic accidents in the US
The data for this chart comes from the WHO Mortality Database, a fantastic data source where you can find statistics on causes of death worldwide. It’s fascinating comparing countries.
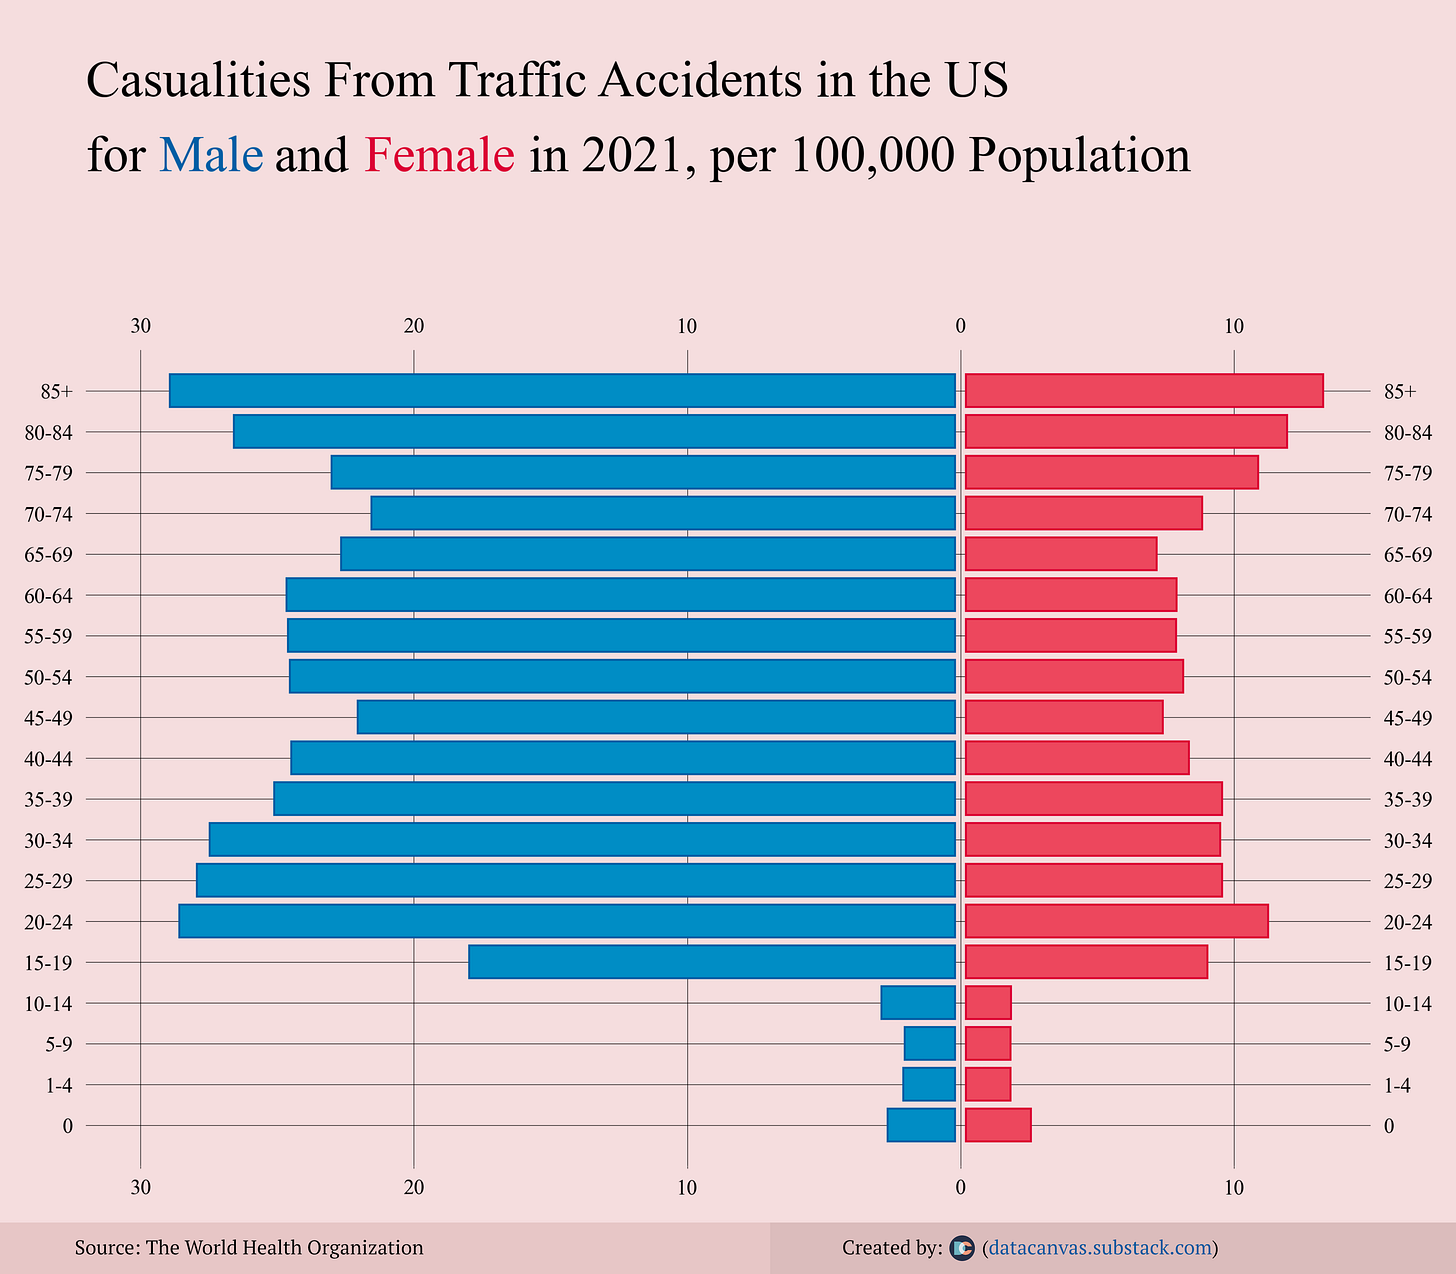
This chart shows the distribution of fatal traffic accidents in the United States for age and gender. The x-axis displays casualties per 100,000 population.
Male drivers outnumber female drivers three times over when it comes to fatal traffic accidents, and it’s clear that young and old drivers are the primary problem.
About the Design
I wanted a clean and colorful design without making it look too happy. The background is a sober beige, and the bars are colorful, but it’s not too much.
I liked the idea of using the title to show what the colors represent instead of adding a legend.
Let me know what you think! 🙏
See you next time!


