


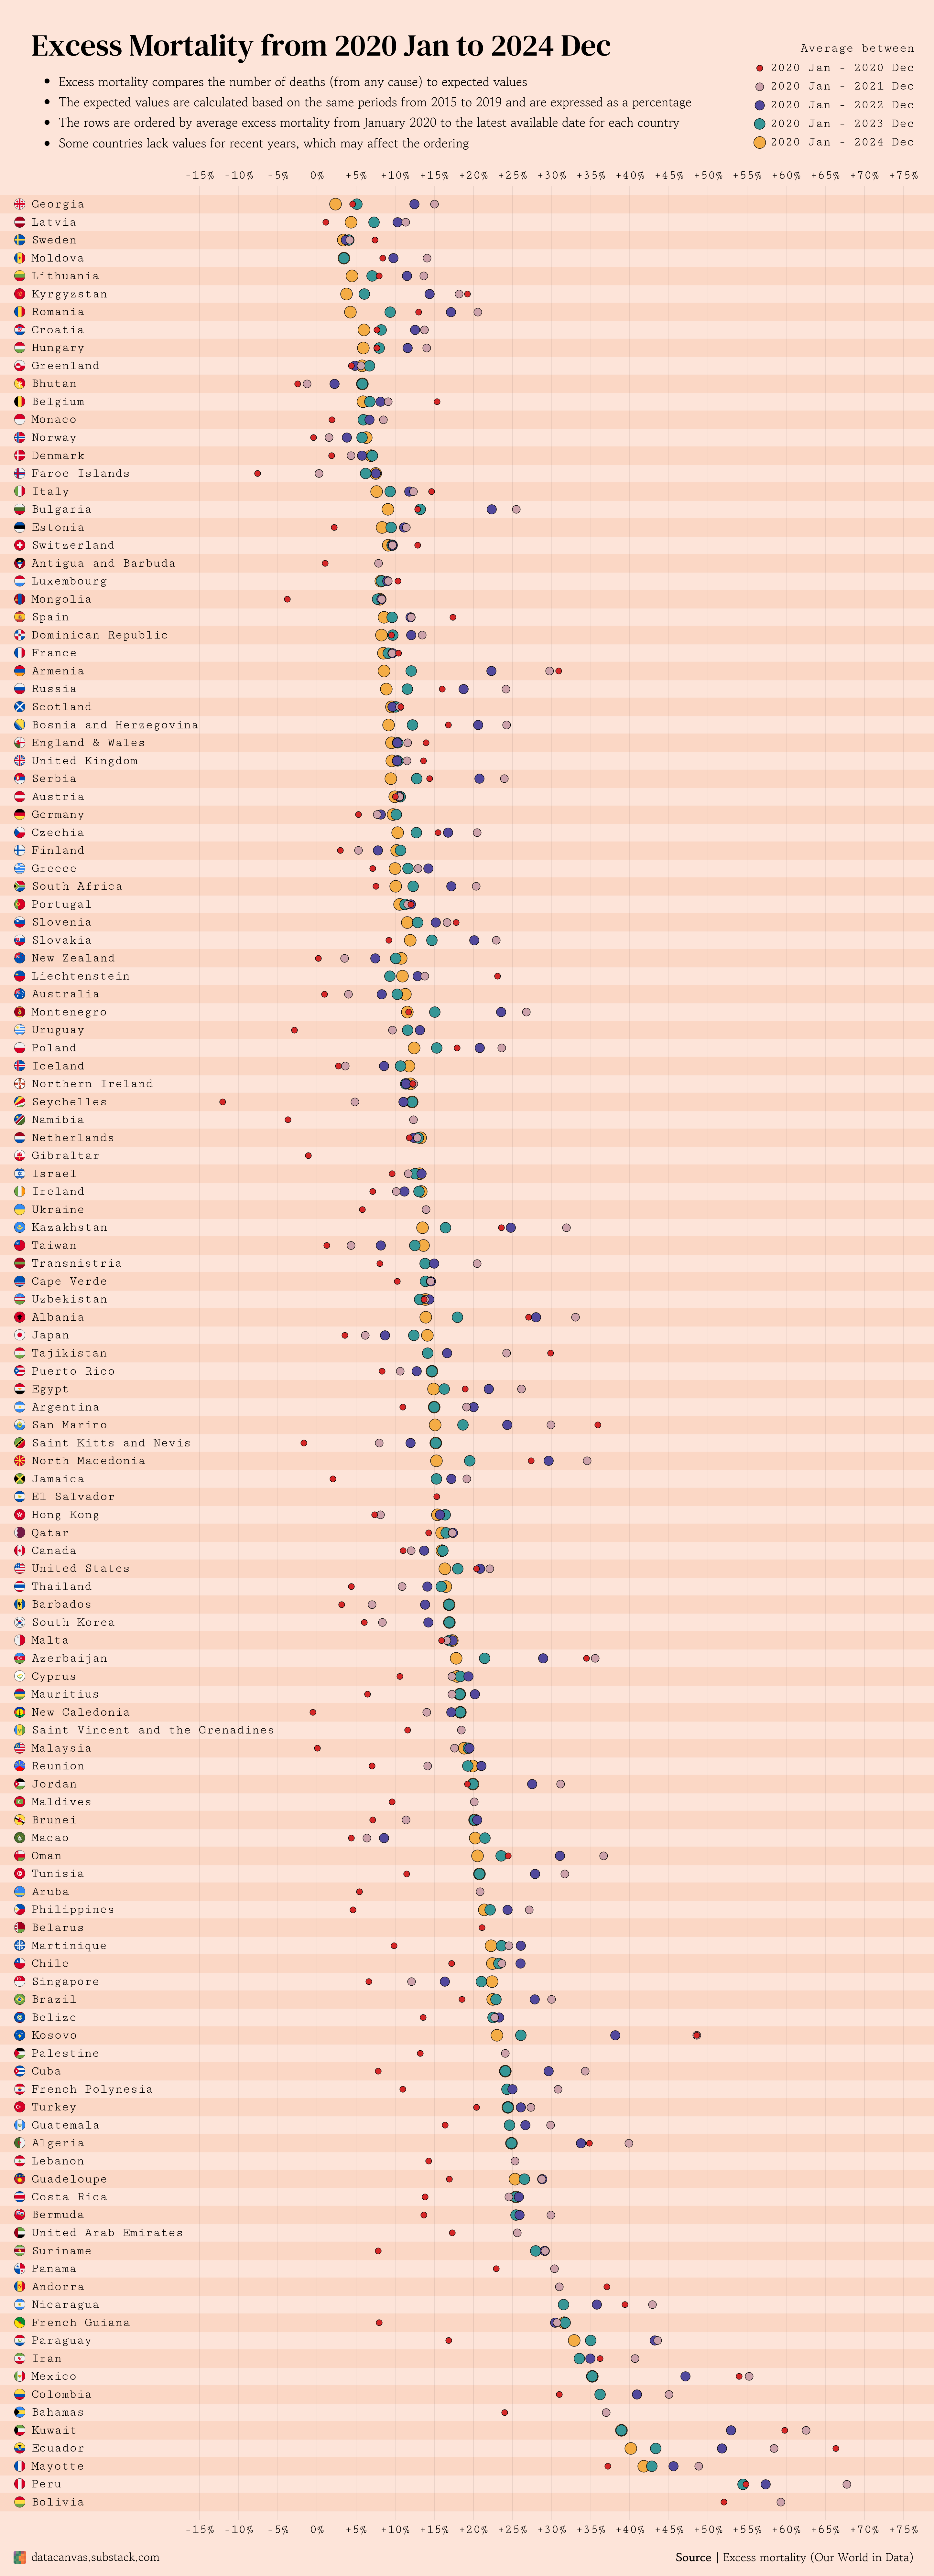
Excess Mortality from 2020 Jan to 2024 Dec
A more extensive data visualizations of excess mortality during COVID-19

Yesterday, I posted a data visualization on excess mortality in Europe using data from Eurostat.
Today, I’m taking a second stab at the topic using another datasource: Excess Mortality (Our World in Data).
I’ve plotted every single entity in the original dataset.
Remember that excess mortality accounts for all causes of death.
COVID-19 is the most unusual event during this time period, but the reason behind some of the numbers may be something else.
Let me know what you think of this data visualization and don’t hesitate to ask questions in the comments.
If you have any topics or datasets that you want me to visualize, send me a message!
Thanks for reading.