
Echoes in the Pyramid: China’s Demographic Story
How historic events and policies left lasting marks on China’s demographics

Hi, it’s me again! 😊
Have you ever wondered how historic events shape a country's demographics? Today, we’ll dive into China's population pyramid and explore how significant moments in history have left lasting impacts.
If you stick around to the end—I’ve included an animation that tracks China’s population from 1950 and forecasts how it might look all the way to 2100.
#1 A normal pyramid for a developing country
In 1950, China’s population pyramid was similar to those of many developing countries at the time: a classic pyramid shape, driven by high birth rates and improving child survival rates, indicating rapid population growth.
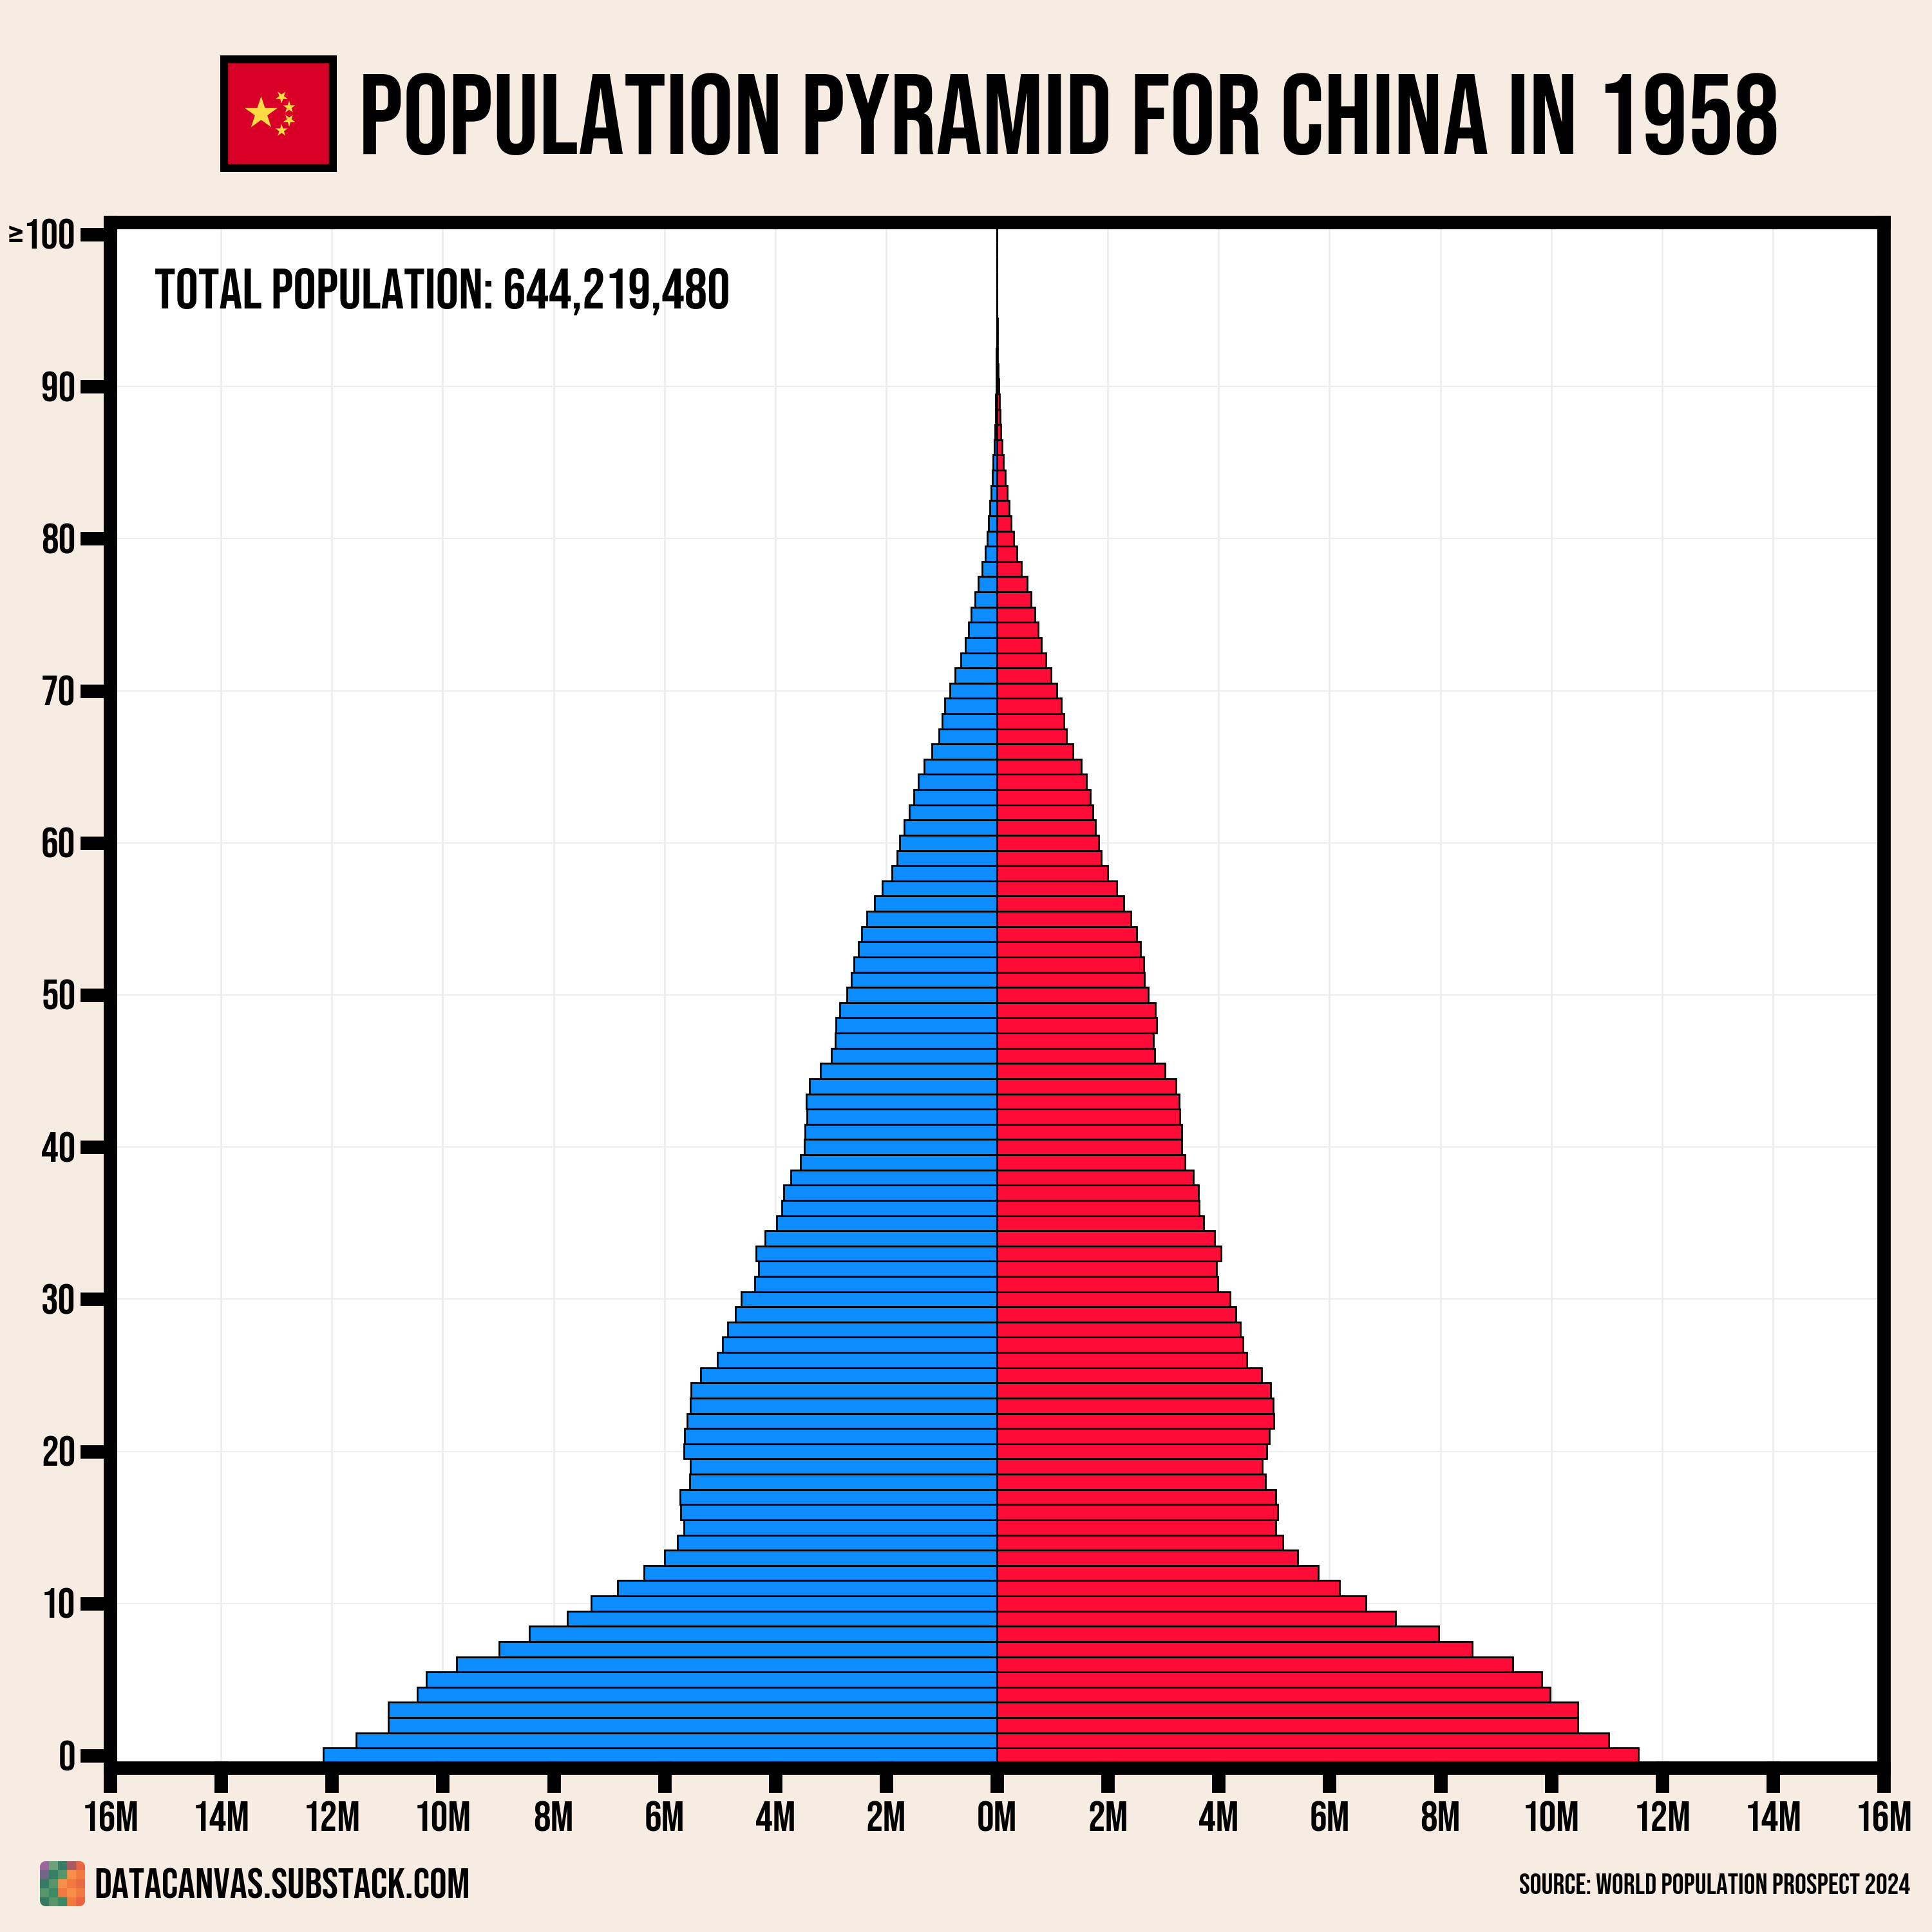
Looking at this pyramid, it's easy to guess what it should look like a decade later—but as Niels Bohr used to say, it’s hard to make predictions, especially about the future.
#2 The Great Chinese Famine
The Great Chinese Famine was one of the deadliest events in human history. Economic mismanagement and radical changes in agricultural policies, combined with severe droughts, led to the starvation of up to 50 million people.
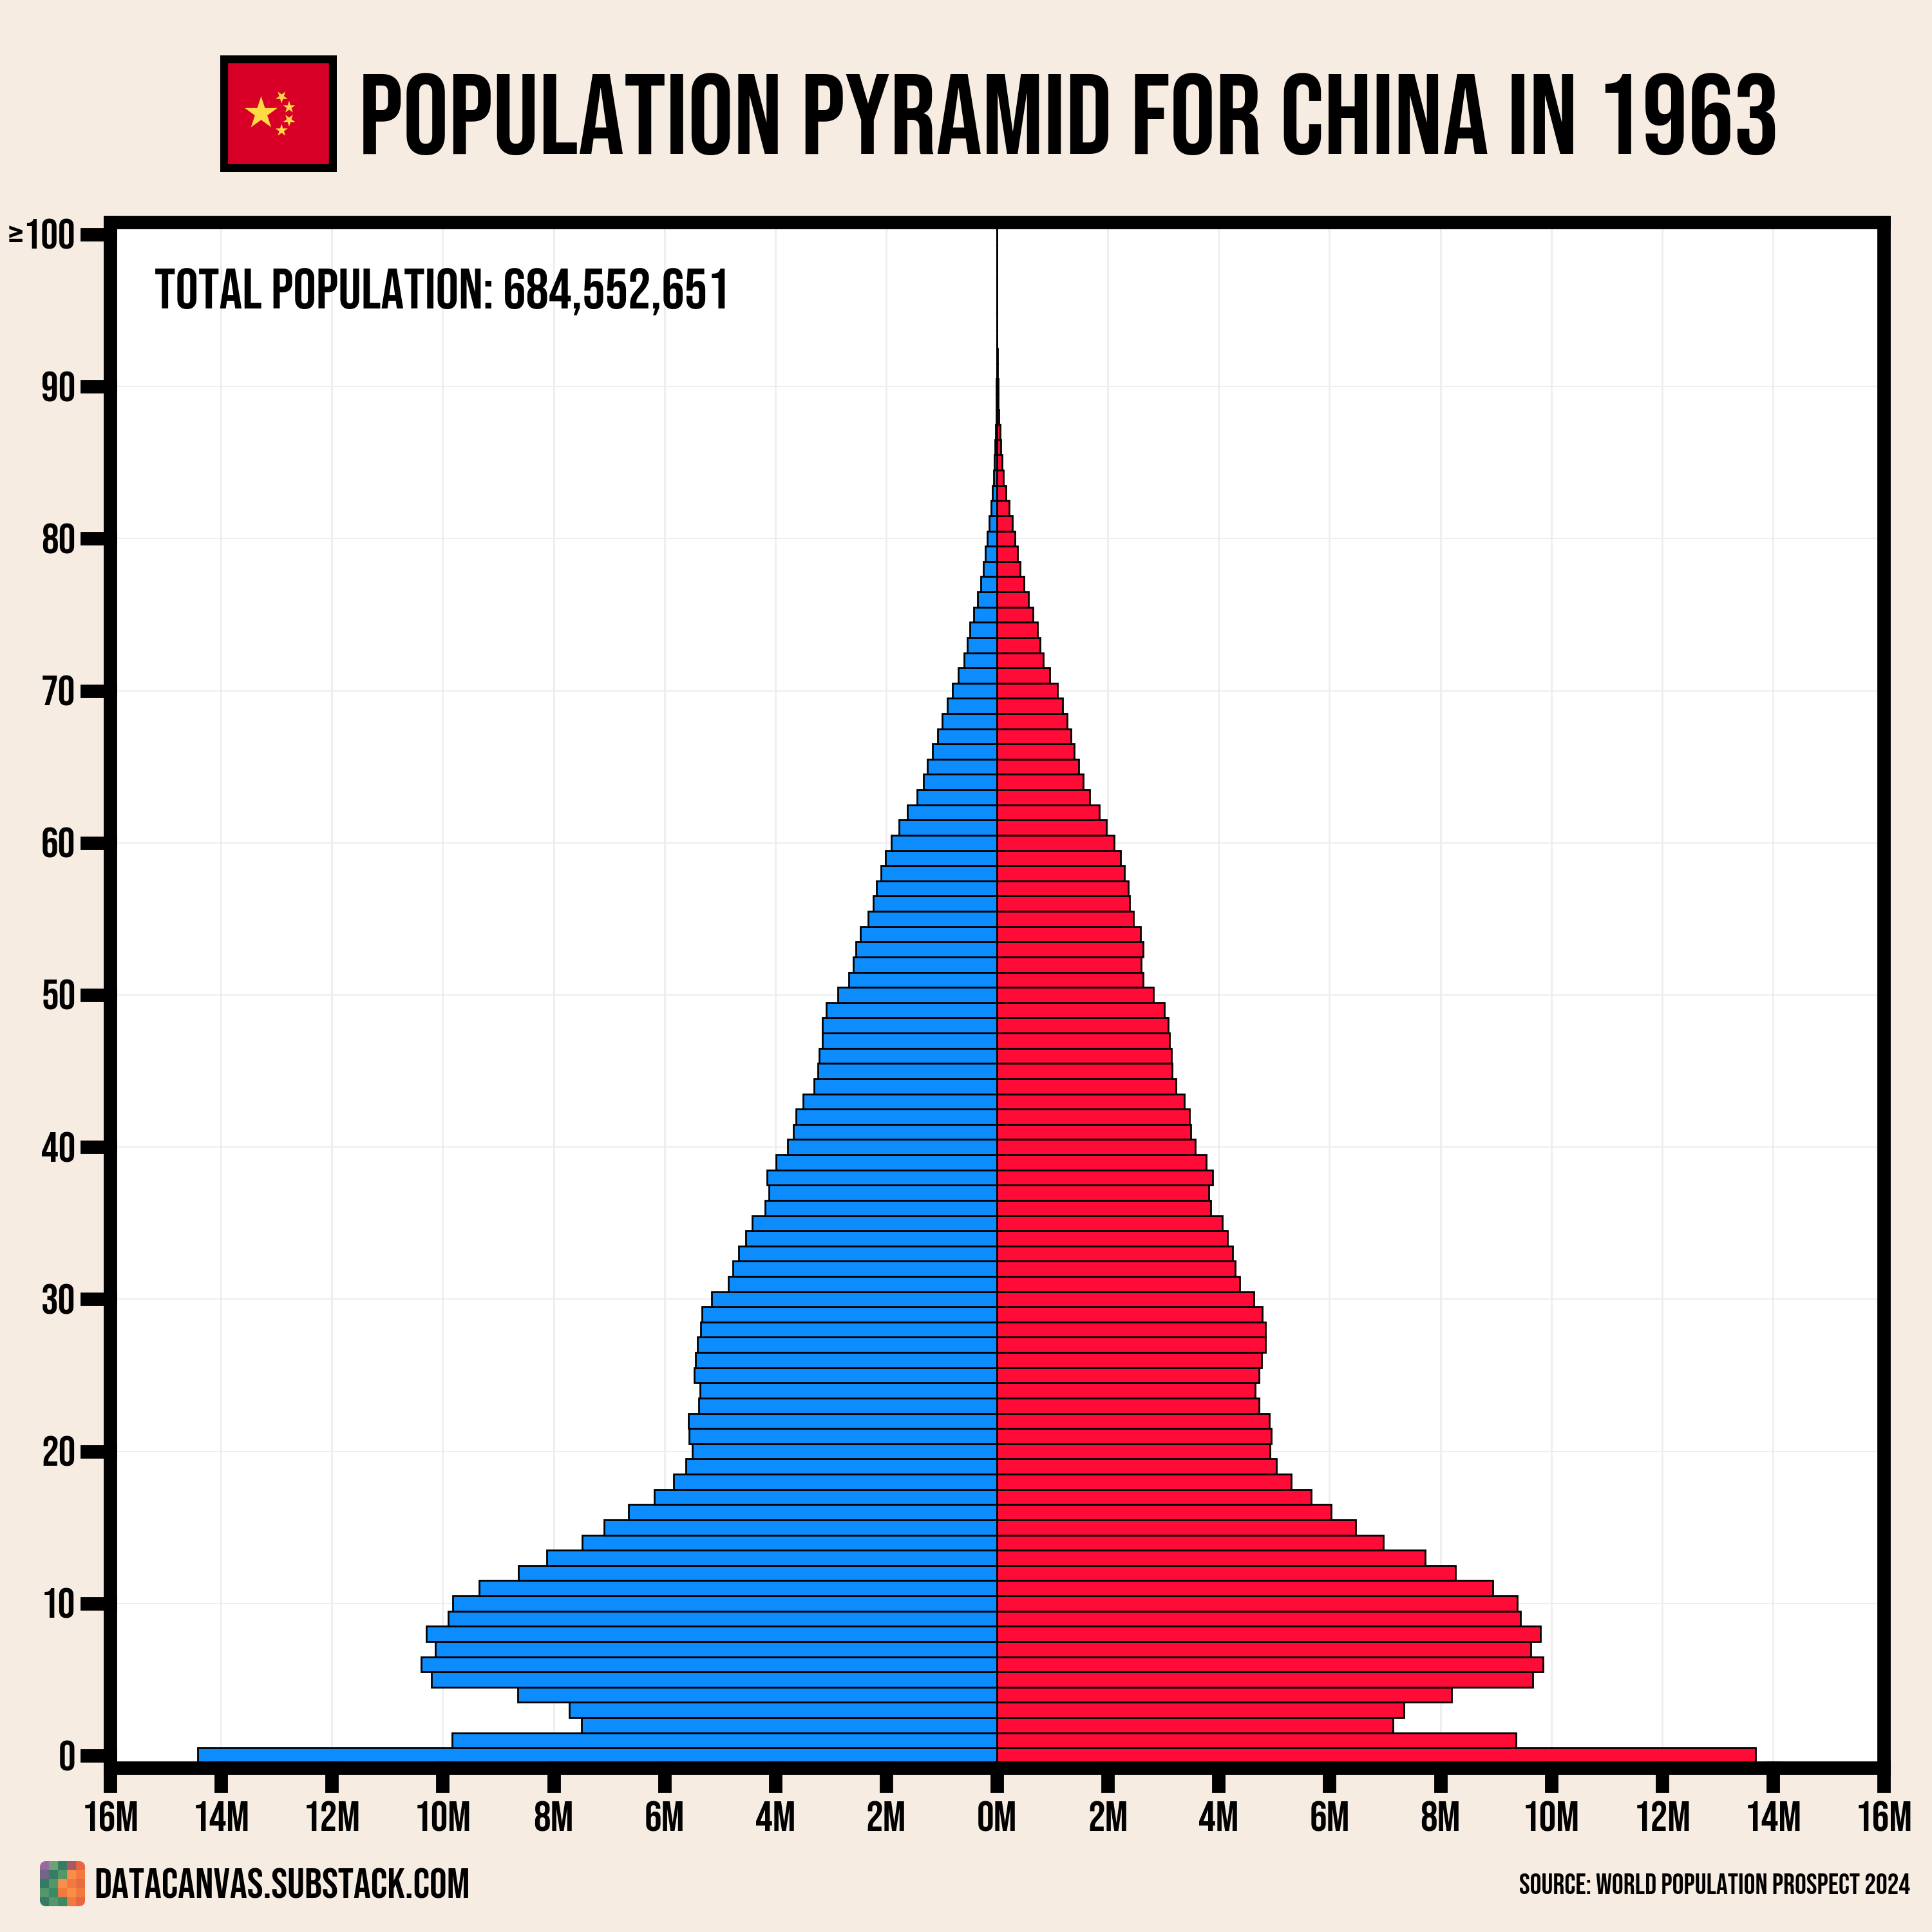
This pyramid shows China's population in 1963, shortly after the famine which occurred between 1959 and 1961. You can clearly see the decrease in the number of children during that period, primarily because of high child mortality.
#3 Later, Longer, Fewer
The Chinese population grew rapidly after the famine and the country’s leaders started to worry about overpopulation. In 1971, they launched the “Later, Longer, Fewer” that urged families to marry later, wait longer between births, and have fewer children.
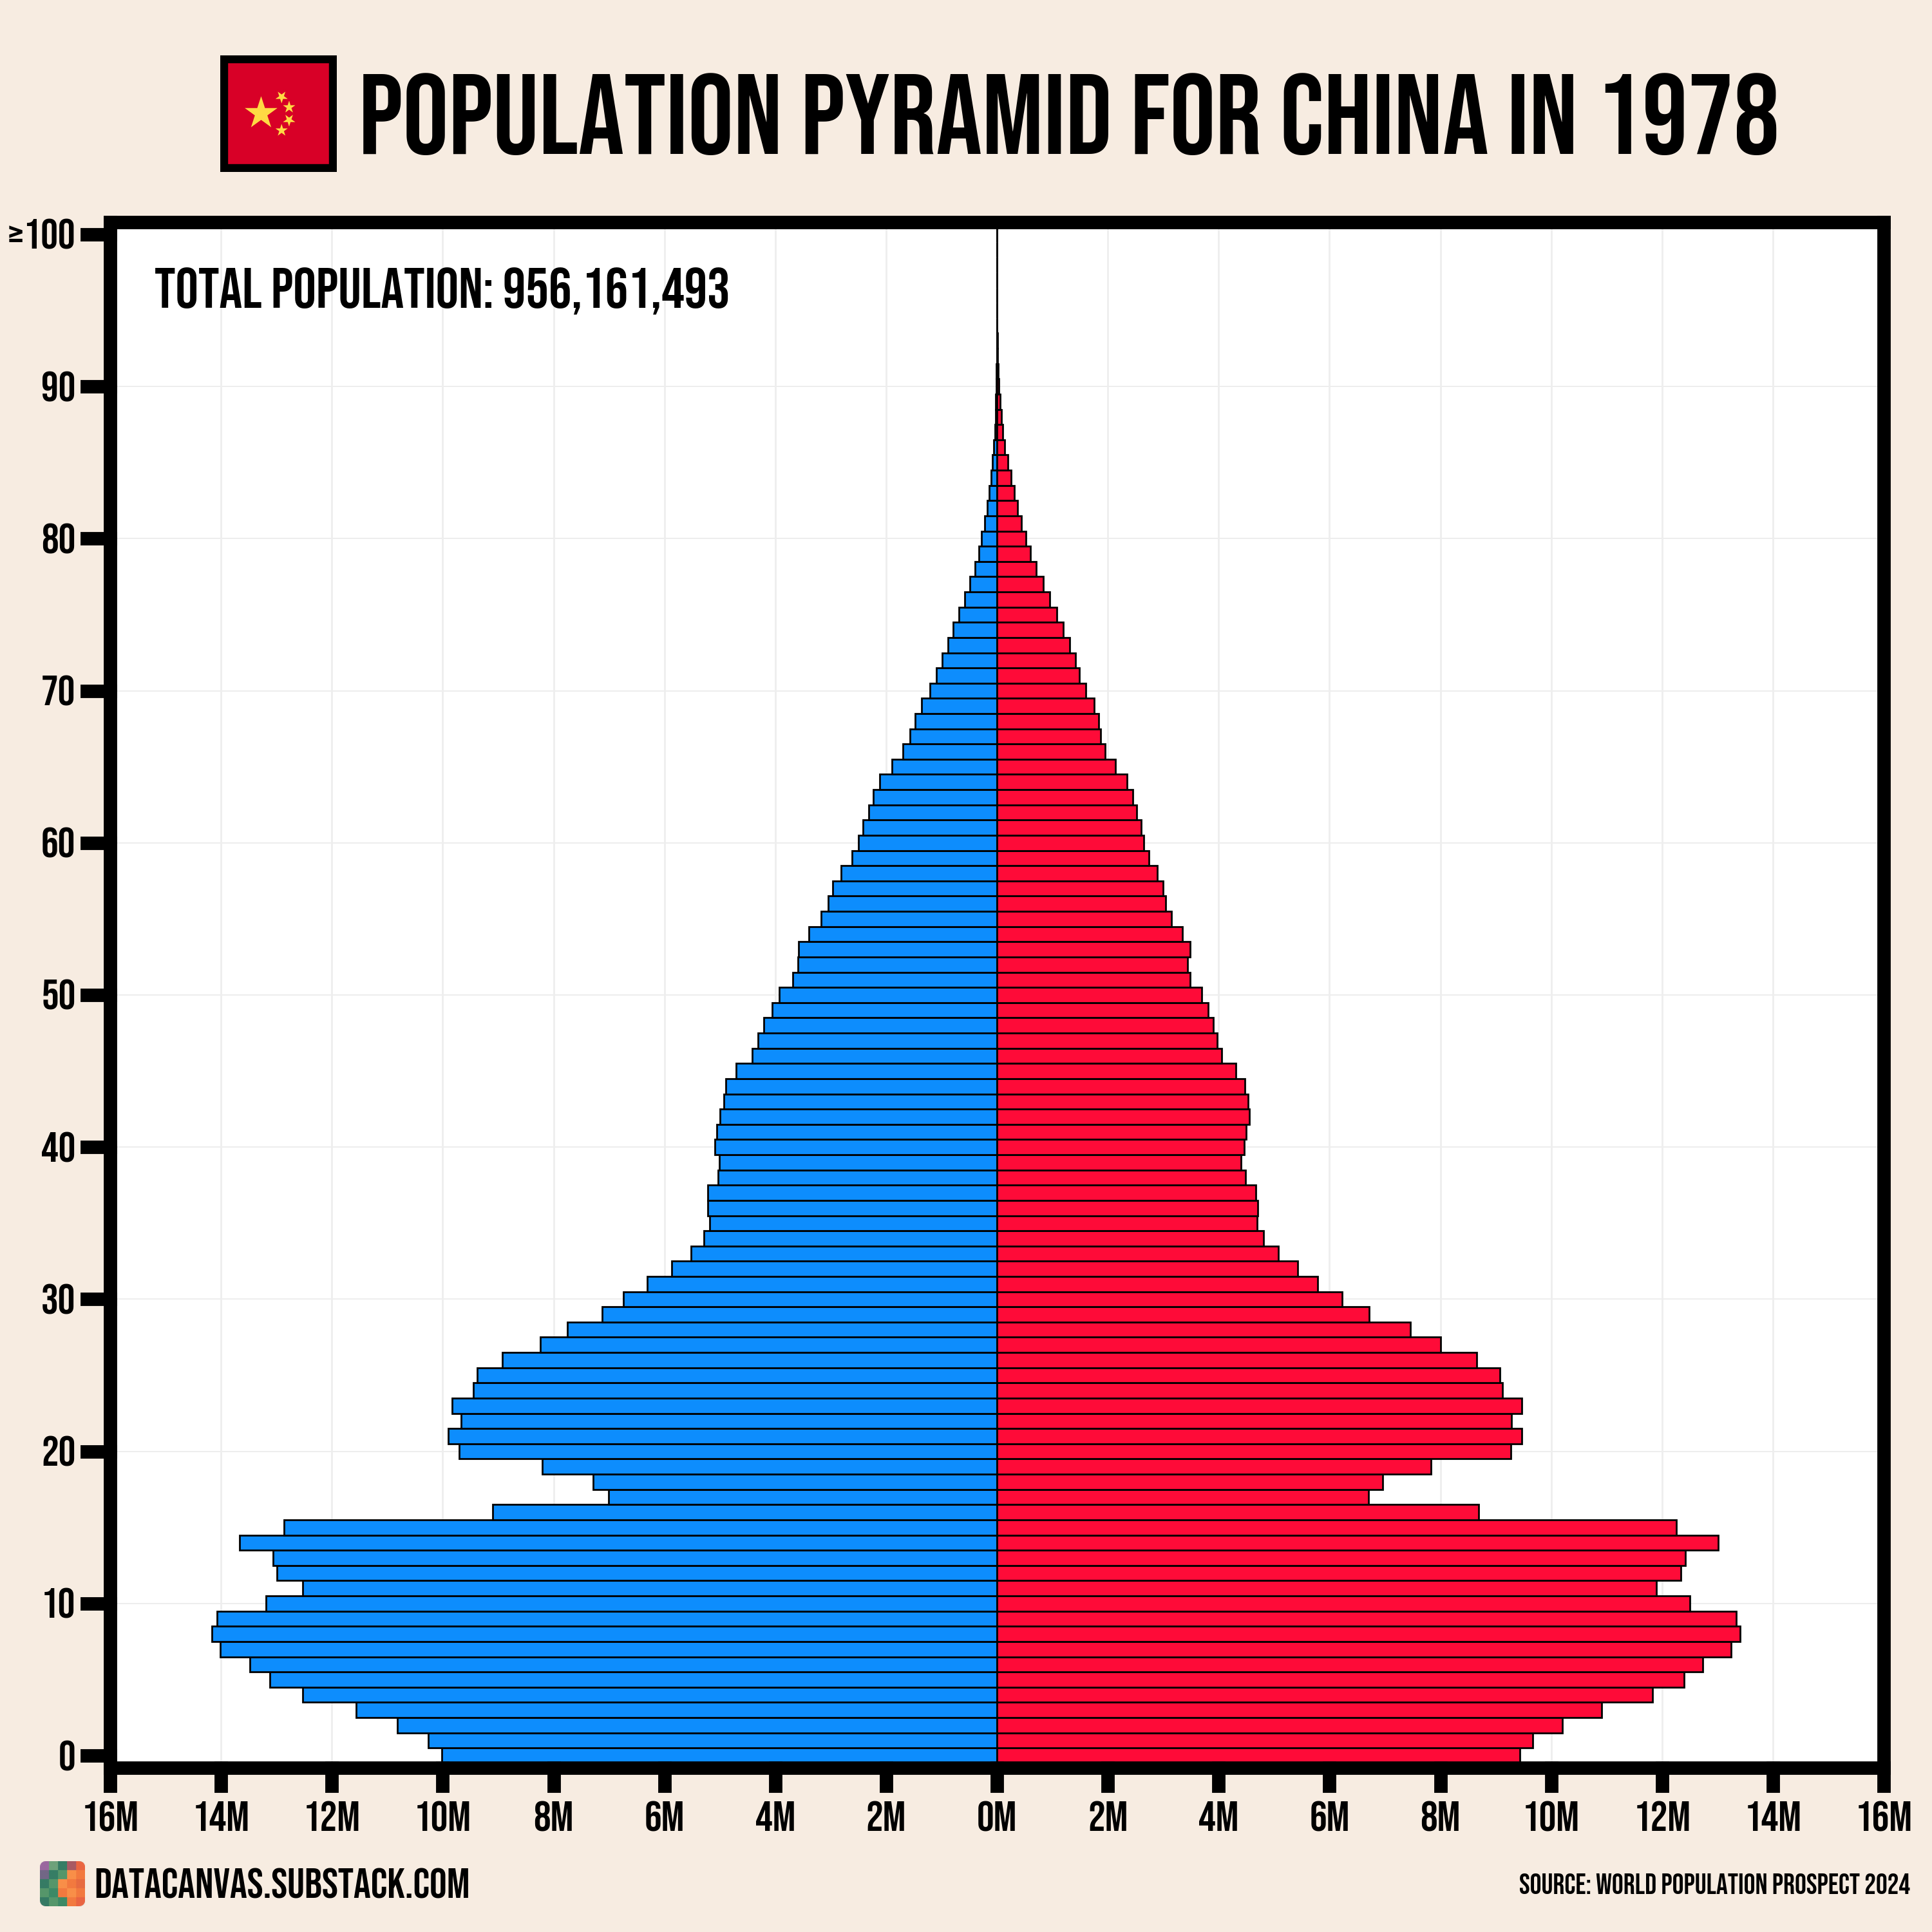
Looking at 1978, the effects of the campaign are clear as day. The fertility rate started dropping immediately, and there are fewer children every year, which you can see at the bottom of the pyramid.
Yet, despite this decline, if you compare the previous two graphs, you'll see China's population still grew by nearly 300 million people between 1963 and 1978. Considering this rapid growth, it's understandable why Chinese leaders viewed overpopulation as a serious concern.
#4 The one-child policy and population momentum
You might expect that the number of children continued to drop immediately after the introduction of the one-child policy in 1979, but that’s not the case. Instead, the number of children increased again because the large generation born after the famine reached reached childbearing age.

But if you look at the chart again, you can see that, even if the amount of children increase, they don’t exceed their parents numbers, and the next generation having children look significantly smaller.
#5 Fast-forward until today
2023 is the last year for which we have historical data, and the shape of the population pyramid clearly reflects the events I've described above.
The number of children born in a given period depends on both the size of their parents' generation and fertility rates. Since most people within a generation have children around the same age, disasters like the Great Chinese Famine create imbalances that echo through a country’s population structure for decades or even centuries.

Today, China's most pressing demographic issue is the dramatic decline in fertility rates—from 1.79 in 2017 down to just 1.00 in 2023. You can see this drop clearly visible in the pyramid, where the number of children under five has decreased dramatically.
What effect will that have for China’s future population?
#6 The demography challenge of tomorrow
To wrap things up, I've created an animation showing how China's population pyramid has evolved year by year, including projections from official UN estimates all the way to 2100. Keep in mind that the future won't unfold exactly as experts predict, but these estimates highlight a genuine demographic challenge that many countries—and China in particular—will face in the coming decades.

The future will certainly be interesting.
#7 Thank you
I’m so glad that more people are subscribing to my newsletter and I hope that trend continues. That’s why I appreciate any like, share, comment, or feedback I can get.
I hope you enjoyed this as much as I did, and thank you for reading.
The video scrolling through was super useful to see the changes year by year! Really ties together the narrative